I sometimes have a tendency to make things more complicated than necessary. I will try to resist that here because Income Tax is already as complicated as it needs to be. My purpose in this post is to show the history of income tax rates to have a basis for future discussions. To do this, I made some arbitrary assumptions to have a thread to follow. All the data in this post is based on that fabled family of four. As the baseline income, I used the poverty level as defined by the US Census Bureau. They first reported this number in 1959 and the latest data readily available is 2020. The values correlate .9968 with the June through June change in the Consumer Price Index, so I used these values to fill in 1952-1958 and 2021 on my chart. I plotted six different levels of income to show the relative effect of the rate structure on their tax liability. The case I call INDV1 is the poverty level as defined and reported by the US Census Bureau. INDV2 is twice that level, INDV5 is five times the poverty rate, etc., INDV25, INDV50, INDV100. Their 2021 gross income before exemptions and standard deduction is shown below:
INDV1 27,925
INDV2 55,849
INDV5 139,623
INDV25 698,113
INDV50 1,396,226
INDV100 2,792,452
I took 4 exemptions and the standard deduction for each year to arrive at the taxable income. The chart shows the PERCENTAGE of income paid in taxes in each year.
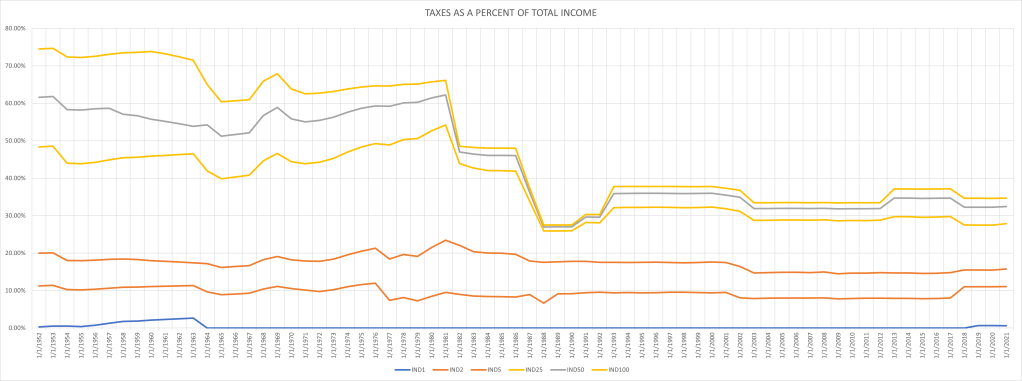
The bottom three income categories have seen relatively little change over the period from 1952-2021. The top three categories saw some very dramatic change during the 1980’s.
My data us from the following sources:
https://inflationdata.com/Inflation/Consumer_Price_Index/HistoricalCPI.aspx?reloaded=true
https://www.taxpolicycenter.org/statistics/standard-deduction
https://www.census.gov/data/tables/time-series/demo/income-poverty/historical-poverty-people.html
